Lead volume is an easy number to celebrate and an easy number to misunderstand. A chief executive or finance leader needs to know whether investment is producing conversations with a credible path to revenue. That takes more than exporting a chart from an ad platform and placing it beside a CRM report.
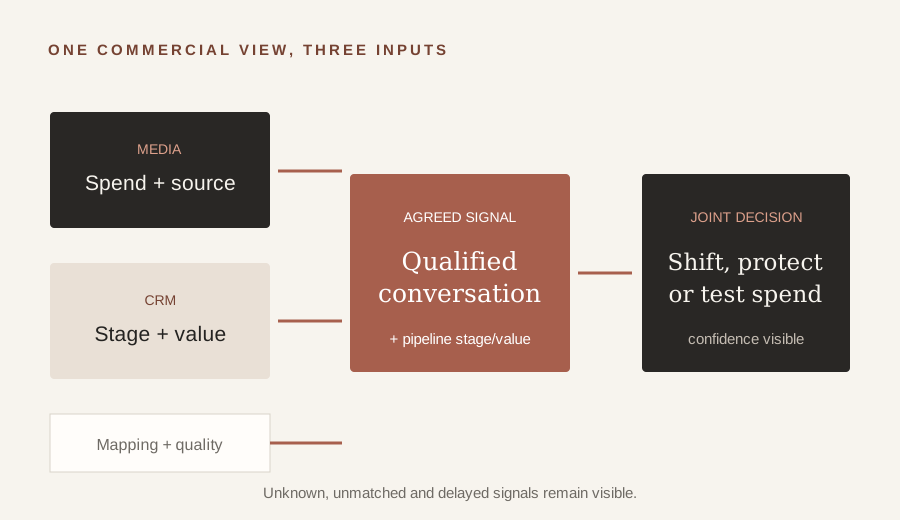
Build one decision view from two imperfect systems
Start with two exports: the CRM view of leads or opportunities, and the paid-media view of spend. Decide whether each CRM row represents a person, a qualified conversation or a deal. The denominator changes the meaning of cost per outcome, so the label belongs beside the number.
Then confirm the fields that connect the records: source, campaign, date, stage, amount and a stable identifier where one exists. Normalize spelling and naming conventions across platforms. Keep empty, unknown and unmatched source values together as an explicit unattributed pool. A tidy chart that quietly drops those rows can reward the wrong channel.
Choose the stage that represents a qualified commercial conversation with sales and finance. Write down who can move a record into it, what evidence is required and whether the definition changed during the period. This gives the organization a shared event to count, rather than a convenient field label.
Compare quality, contribution and confidence
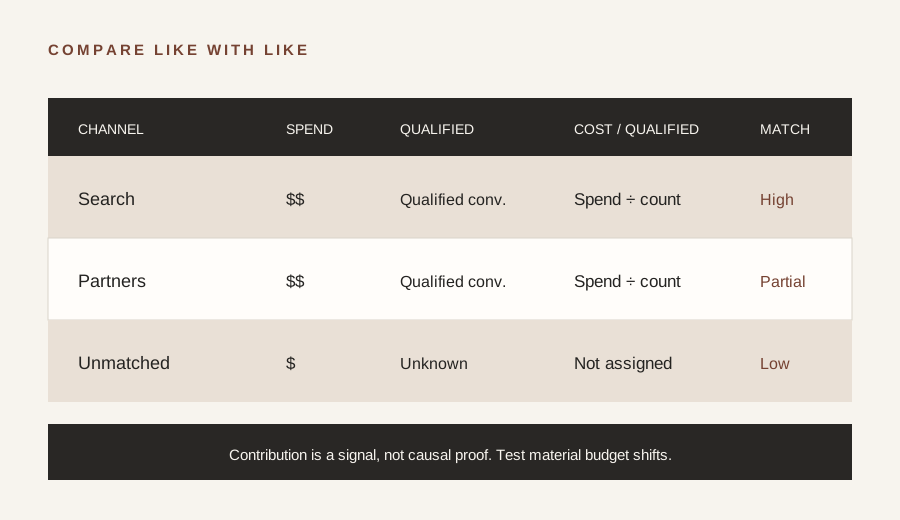
For each source, show spend beside qualified conversations, cost per qualified conversation, pipeline value and the share of total qualified activity. Pipeline velocity can add context when stage dates and progression are reliable. Where sales cycles are long, compare cohorts that have had enough time to mature; a recent cohort should not be judged as if it has already completed its journey.
Use the view to ask practical questions. Is a channel taking more budget than its share of qualified conversations? Does a lower-cost source move forward at a different rate? Is a high-value source underfunded, or simply too small to assess yet? What proportion of spend or pipeline has no dependable source? These questions guide an investigation; they do not automatically prove that a channel caused the outcome.
That distinction matters in the boardroom. Platform attribution is one kind of evidence. Reconciled CRM data is another. Incrementality experiments, holdouts or carefully designed market comparisons can test whether activity changed outcomes. State which method is being used, the period it covers and what it cannot establish.
Turn measurement into an investment conversation
Agree with finance on a short set of definitions before the review: qualified stage, cost denominator, pipeline window, attribution rules and data coverage. Put the assumptions beside the results. Then give each finding an owner and a decision: protect, increase cautiously, improve the hand-off, run a test or pause pending better evidence.
CMOs are under pressure to make that connection. In a LinkedIn and YouGov survey of more than 1,000 B2B marketers across the United States, United Kingdom, France and India, 78% of B2B CMOs said proving ROI had become more important over the prior two years. The survey describes respondents’ reported priorities, not a universal measure of marketing effectiveness. Read LinkedIn’s survey announcement.
Salesforce’s 2026 State of Marketing report draws on a survey of 4,450 marketing professionals and reports that only 56% of marketers have full access to sales data. That is a useful reminder that a measurement problem can be an operating-model problem as much as an analytics problem. The figure is survey-reported access, not an audit of every organization. Read the report and methodology.
Pipeline IQ is a self-directed prototype that demonstrates this kind of reconciliation with CRM and paid-media CSV exports. Its calculations are deterministic: it supports lead-level or deal-level records, lets the user confirm columns and qualification stage, and keeps unknown or unmatched sources visible. It is a prototype, not a client deployment or evidence of commercial results.
Sources & further reading
- LinkedIn and YouGov, B2B campaign performance survey announcement, 18 February 2025. Survey of 1,000+ marketers across four named markets; respondent-reported priority.
- Salesforce, State of Marketing, Tenth Edition, 2026. Survey of 4,450 marketing professionals; access figure is self-reported.